03Investment research
Custom MST Research System
Screen stocks by your own rules
Sector rankings, watchlists, price and volume on one screen. No more rebuilding market data by hand.
What it’s for
MST is built around how its user researches: see which sectors are strong, compare stocks within an industry, then focus on the watchlist.
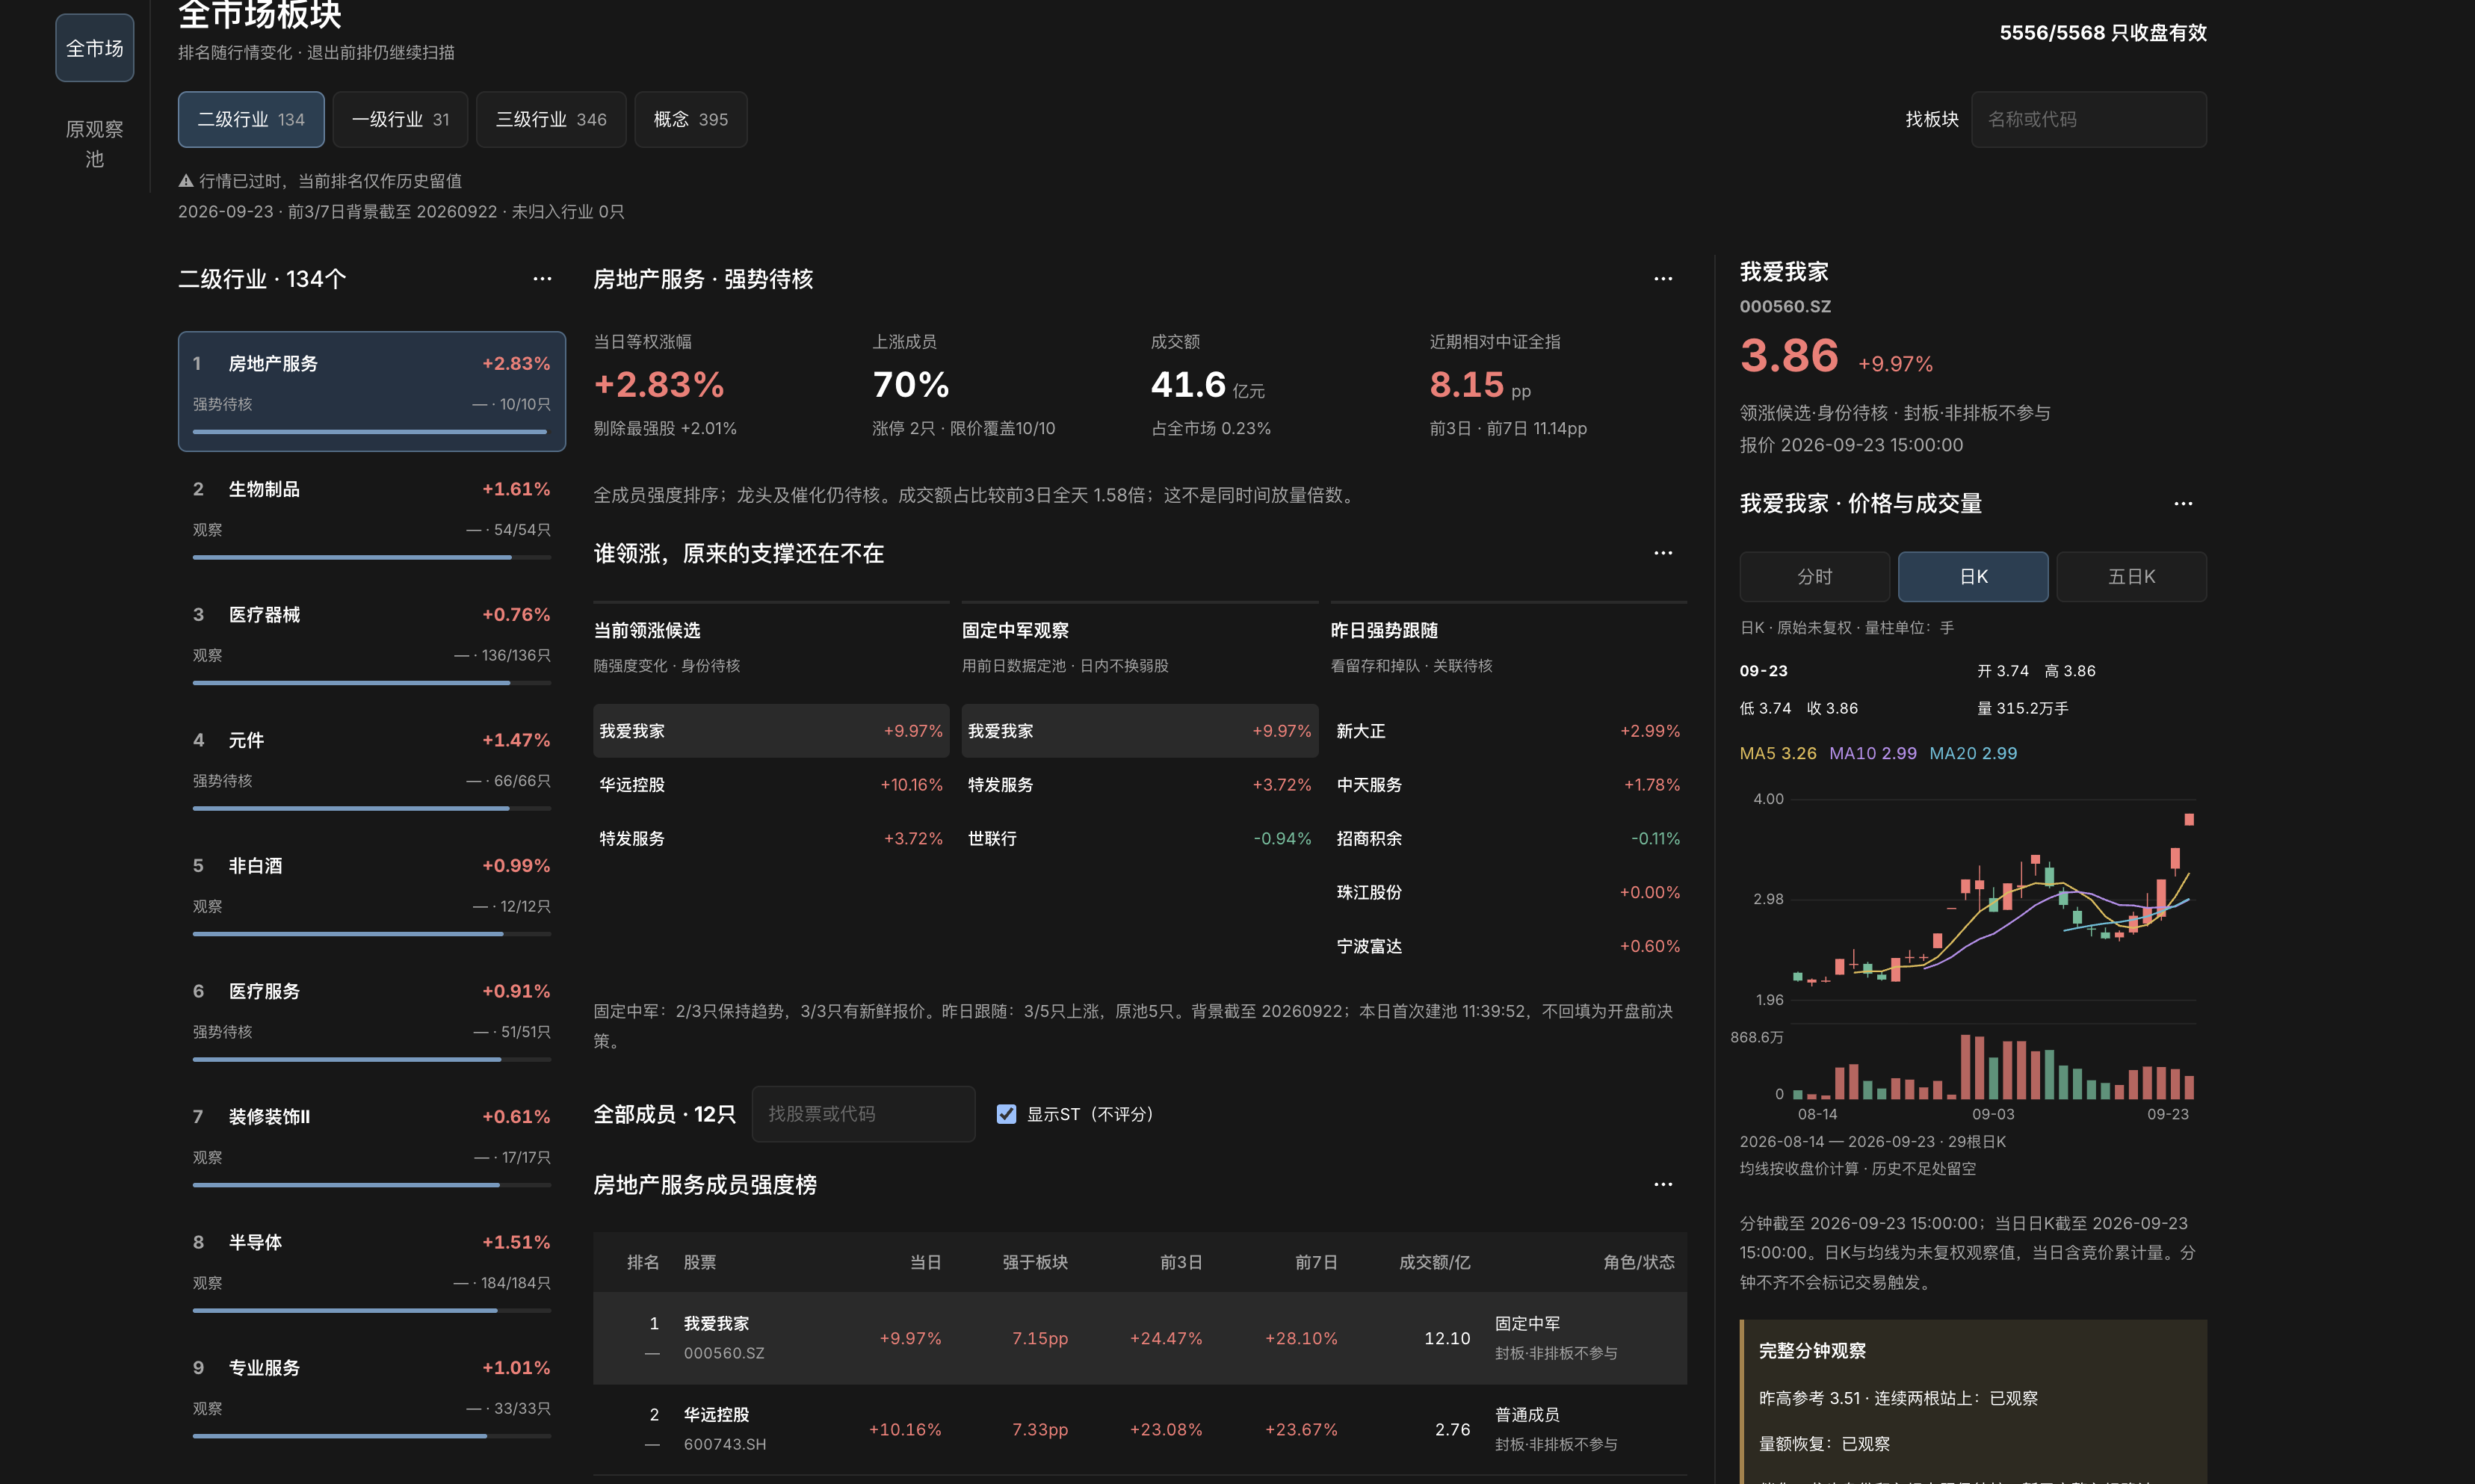
Market-wide sectors, industry strength, the watchlist and stock charts sit together, read in a fixed order. Coverage, screening rules and metrics can all follow the research method.
How to read a stock
Pick an industry and check its gain, share of rising stocks and turnover; then pick a stock for price, volume and candlesticks.
Every view shows the market date and data status, so current and historical data never blur. The screenshot is a historical view supplied by the project; the system supports research only and never places orders.
What it saves
Your key metrics and lists live in one place: no rebuilding sheets, no switching between market apps. Screen the same way every time, and look back at the data and the call you made.
Our take
Everything you check, on one desk.
What’s customized is the research routine: what to look at first, how to screen, what to compare. Investment decisions always stay with the user.
- Check sector rankings
- Screen and compare
- Review charts and history